The following report was produced by Grassroots Lab and Grizzly Bear Media
Much has been written about the abysmal voter turn out in this fall’s California election. Everything from voter apathy to sophisticated micro-targeting has been blamed for the record-low participation rates.
But missing from much of the post-election analysis is a simple fact that has long been known to depress voter turn out – high rates of poverty are directly connected to lower rates of voter participation.
California is both the richest and poorest state in the union. With a GDP of more than $2 trillion, it ranks on its own as one of the world’s largest economies. But California also has more poor people and higher rates of poverty than any other state.
More than 1 in 5 of the state’s 38 million residents live in poverty, according to the latest U.S Census Bureau report .
Under a new method of calculating poverty, which takes cost of living and other factors into account, California has a poverty rate of 23.4 percent, with more than 8.9 million people below the new poverty standard.
When comparing the state’s most affluent areas with those that have among the highest rates of poverty, there is a dramatic difference in the level of voter participation.
We compared economic status and voter-participation rates in the San Francisco Bay Area with those of Los Angeles. Six of the state’s 7 most affluent counties are in the Bay Area and all among the 15 richest, when measuring average household income.
According to statistics from the U.S. Census Bureau, the Bay Area has a population of slightly more than 7.1 million, with a poverty rate of 11.2%. That means nearly 792,000 people in the nine-county area were in poverty.
Los Angeles County has a population that just topped 10 million, with a federal poverty rate of 18.2%, which translates to more than 1.8 million people living in poverty.
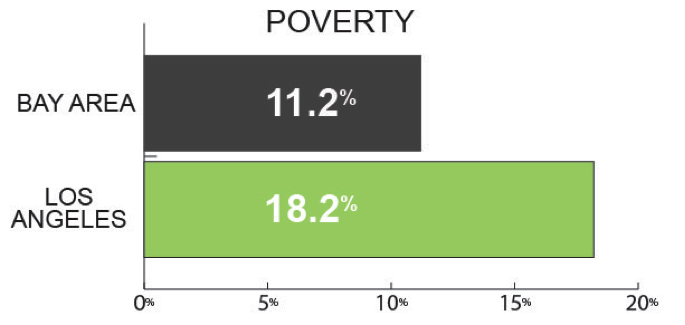
Regional poverty rates. Source: U.S. Census Bureau
The higher poverty rates correspond with lower rates of voter participation. This fall, turnout among eligible voters in the Bay Area was 35%. In Los Angeles, it was 23.1%. Despite the fact that Los Angeles has about 3 million people more than the Bay Area, and 1.1 million more eligible voters than the Bay Area, there were 300,000 more votes from the Bay Area than LA in November.
Put another way, poverty rates in LA County are 64% higher than in the Bay Area, while political turnout in the Bay Area was 52% higher than in Los Angeles.
There is much discussion about why turnout is lower in Los Angeles. There are more younger voters. There are more Latino voters in the county than there are in the Bay Area. Some even blame the LA County Registrar’s office, particularly the regime of Conny McCormack who was not as aggressive at encouraging residents to vote by mail as some other county election officials were. But poverty rates provide part of the answer.

November 2014 voter turnout. Source: California Secretary of State
We focused on the two major urban economic engines of the state. Both Los Angeles and the Bay Area have comparable, expensive media markets, similar high housing prices and are the two major population centers of the state, comprising nearly half of the state’s population between them.
In the Central Valley, for example, poverty rates are higher than even Los Angeles – about 23.7% in 8 valley counties compared to 18.2% in Los Angeles. Turnout was still low in the Valley – 27 percent, which is closer to the lower LA turnout than the Bay Area numbers.
Others have focused on home ownership as a better indicator of voter participation, but that’s not perfect either. Home ownership rates in the Central Valley are higher than the Bay Area or Los Angeles, but turnout is somewhere in the middle.
There are lots of reasons why that may be, from rural vs. urban distinctions to cost of living. We argue comparing Los Angeles to the Bay Area – the state’s two largest urban centers and economic engines – offers the best “apple-to-apples” comparison.
The comparison suggests a strong correlation between socioeconomic status and propensity to vote.
California’s growing poverty rate is a threat it its democratic institutions. Apathy may be a long-term trend for a number of different reasons, but the implications are significant for our state. As our Latino population becomes younger, larger and poorer, it will increasingly be governed by a political class that is older and whiter than California as a whole. This is not just the situation now, but will be for years to come unless the state can do something to reverse the growing poverty trend – particularly among Latinos, who comprise a plurality of the state’s population.